
Fueling Performance | Fleet Fuel Savings Calculator
How much can your fleet take out of fuel cost per mile?
Enter your truck count and what you pay at the pump. Everything below recalculates against your fleet — adjust any assumption to see it move.
Estimated annual savings
$1,362,622
$6,813 per tractor, per year
Per gallon equivalent
39.7¢
On 3,428,571 gal purchased
Where it comes from
Each lever is calculated independently against your baseline, so the total is an upper estimate where they overlap. Figures are an illustration built from your inputs, not a quote or a guarantee — a pilot measures the real number against your own transactions and telematics.
See it run on your own routes. A pilot scores your actual fuel plans against what your drivers really bought.
Schedule a demoHow the estimate is built
Four levers, each measured against your baseline
Fuel cost per mile is the price you pay at the pump divided by the miles a gallon takes you. Each lever below takes a slice off your annual fuel spend; what is left is divided back over the same miles, so the new cost per mile sits next to the old one.
Fuel Optimizer
gal × ¢/galEvery gallon you buy, at the cents per gallon the optimizer saves by steering drivers to your negotiated prices along the route. In the product it is scored on every fuel plan as PPG savings against the route’s reference price.
$342,857 at the defaults10¢ × 3,428,571 gal
Fuel OptimizerTheft monitoring
gal × % × $/galThe share of purchased gallons that never made it into a truck, at your price. Every transaction is checked against the truck’s GPS location, tank level and consumption, and overages are flagged.
$154,286 at the defaults1.0% of gallons purchased
Fuel Theft MonitoringDriver efficiency
(gal − mi ÷ new MPG) × $/galThe gallons you stop buying when fleet MPG moves up, at your price. Driver efficiency alone can make up to a 1.0 MPG difference between equal equipment; coaching on idle, cruise control and high torque closes it.
$634,051 at the defaults7.0 → 7.30 MPG
Driver PerformanceOut-of-route miles
mi × % × $/miMiles cut from routes, at your baseline cost per mile. Compliance scoring reports out-of-route miles and what they cost after every trip, by fleet and by driver.
$231,429 at the defaults360,000 mi × $0.643/mi
Compliance scoring
Worked example
At the defaults — 200 tractors, $4.50 a gallon, 120,000 miles a year at 7.0 MPG — the four levers add up to $1,362,622 a year, $6,813 per tractor, and take fuel cost per mile from $0.643 to $0.586: 39.7¢ on every one of the 3,428,571 gal purchased, or 8.8% of a $15.4M annual spend.
From estimate to measured
The calculator estimates. A pilot measures.
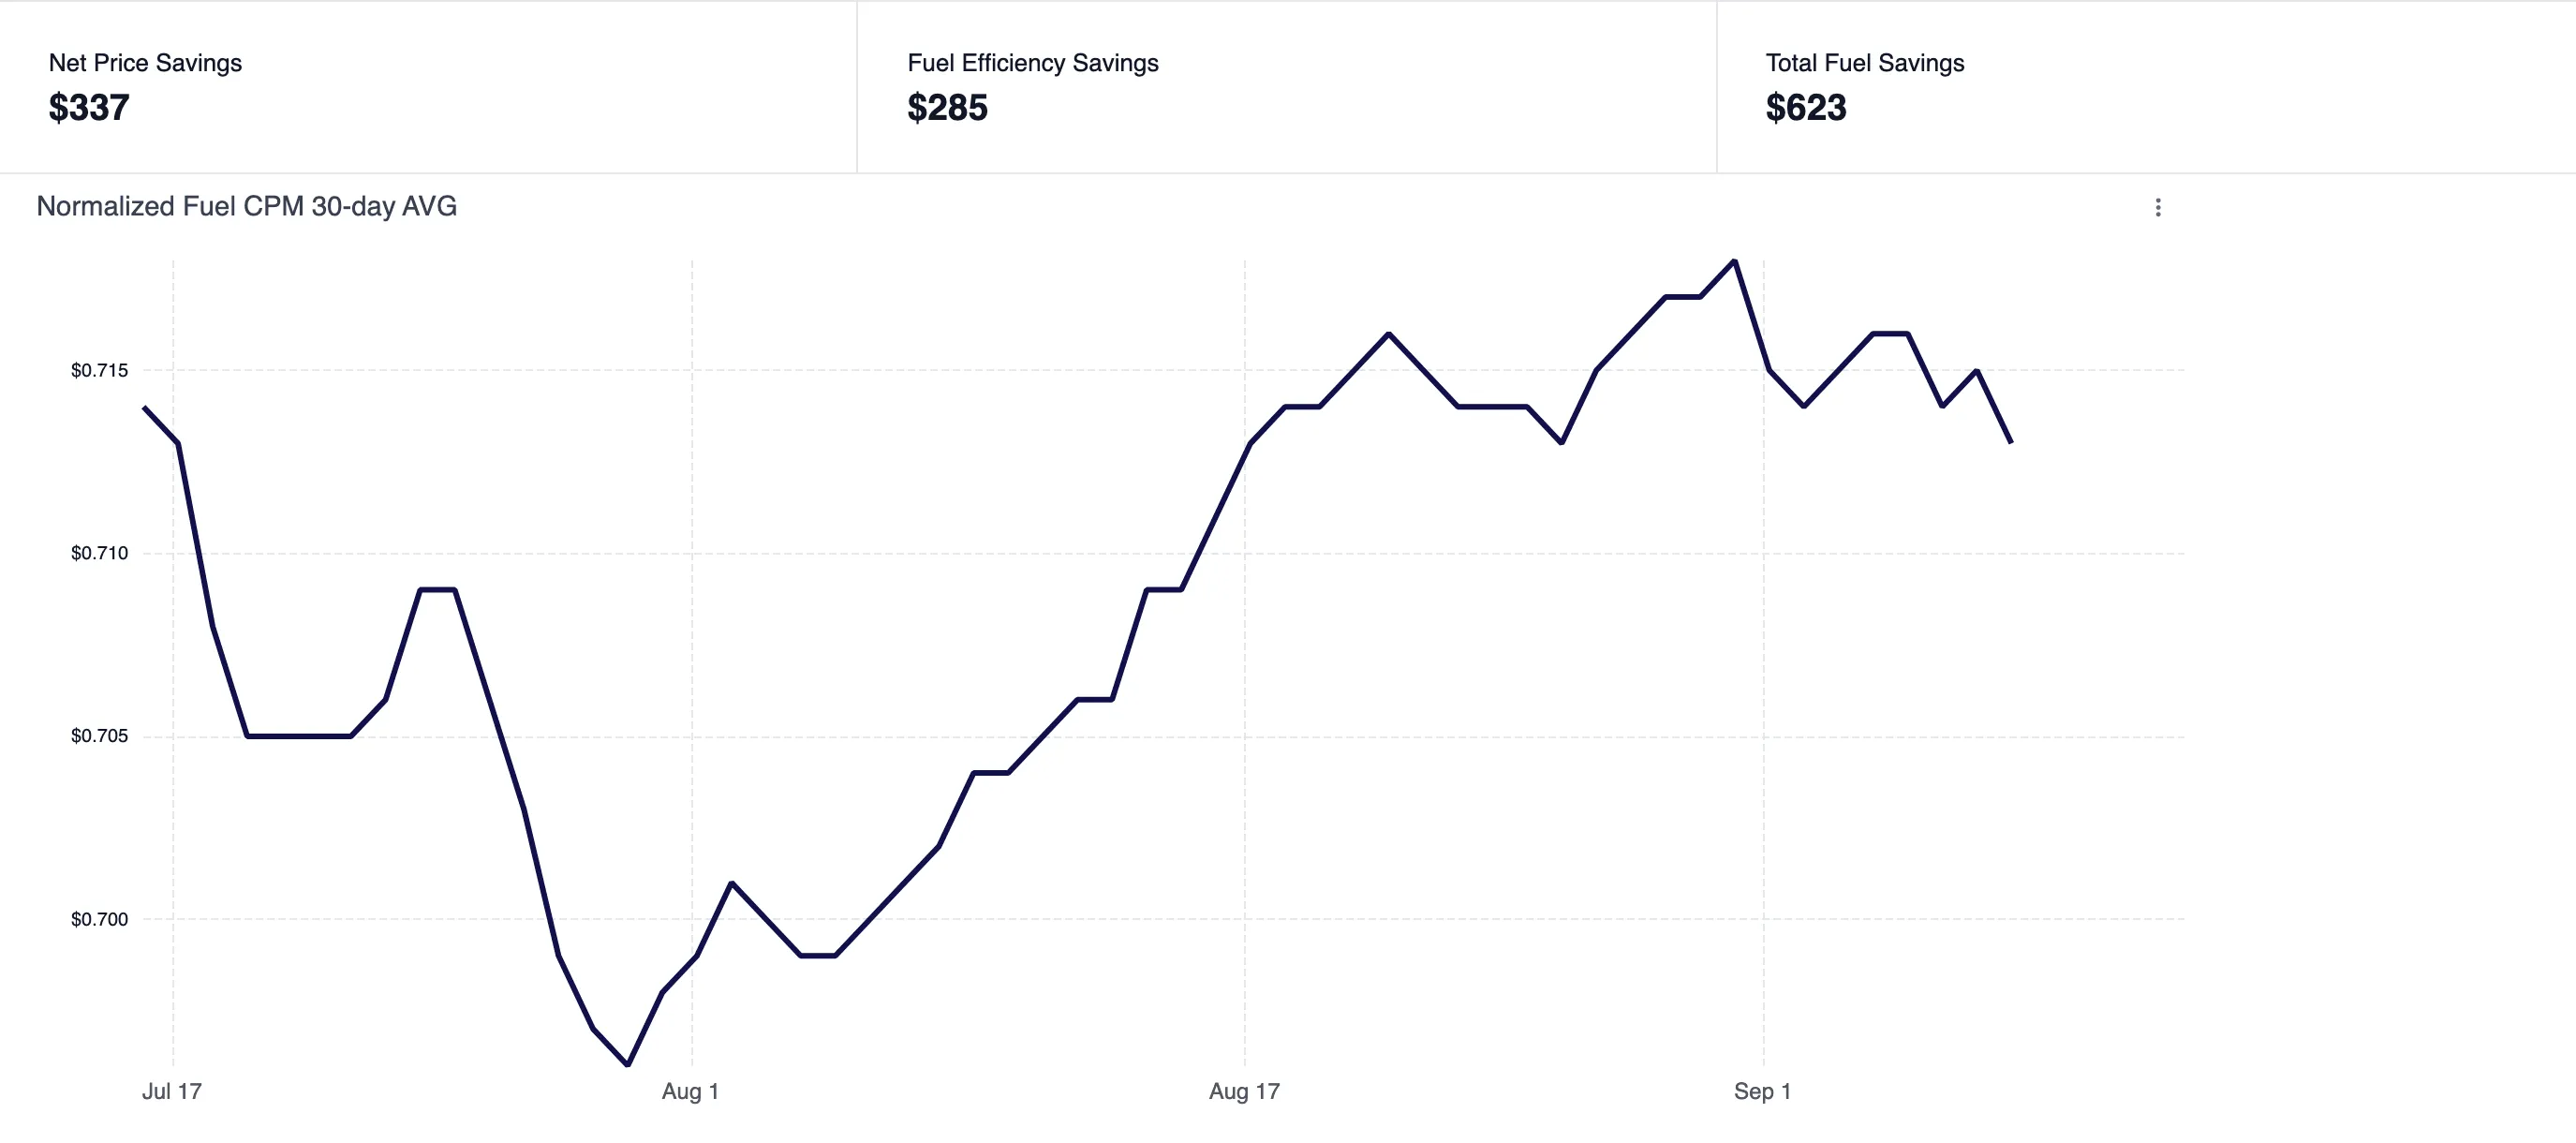
Connect your telematics and fuel-card data and the Control Center reports the same four levers from your own transactions, not from assumptions.
- Net price savings and fuel-efficiency savings, rolled into a normalized fuel cost per mile
- Gallons purchased against gallons consumed, with the fuel overage by vehicle
- Fuel-plan savings per gallon and PPG versus plan on every scored route
- Out-of-route miles and what they cost, by fleet and by driver
FAQs
Questions about the numbers
Four of the eleven questions fleet managers ask us. Read all eleven on the What is Fueling Performance page.
How does Fueling Performance actually lower our fuel cost per mile?
It works on two fronts. On consumption, we flag vehicles with declining MPG and coach drivers on idle, cruise control, and high torque. On cost, we help you buy fuel at better prices and catch theft before it eats into your margin. This is usually the number one expense after drivers and wages, so a few cents per mile adds up fast.
What kind of savings have fleets actually seen?
Fleets have seen meaningful savings by shifting fuel purchases toward better-priced locations instead of fueling wherever is most convenient. Even within the same region, price differences between locations can be significant, creating a real opportunity to lower fuel cost per mile.
What's the Fuel Optimizer and how is it different from just picking the cheapest station?
The optimizer looks at your whole route, not just the next exit. You give it a vehicle and destination, and it overlays your negotiated pricing along the route to pick the best fueling locations. Since we know the planned route and mileage, we can also measure compliance, whether the driver actually fueled where we told them to.
What's the compliance score measuring?
Two things: fulfillment, whether the driver loaded the recommended amount of fuel, and discipline, whether they stopped at the recommended location. The overall score combines both to give you a clear view of fueling compliance.
Next step
Book time to review your fuel operation
Walk through your fleet data and identify where cost, loss, and efficiency can improve. Use our Calendly scheduler to pick a time that works for you.