
Fueling Performance | Fleet Fuel Optimization Software
Optimize Fuel Purchases. Improve Fuel Efficiency. Lower Fuel Cost Per Mile.
Fueling Performance is a fleet fuel optimization platform that helps fleets optimize every fuel purchase, monitor every gallon, and improve driver fuel efficiency.
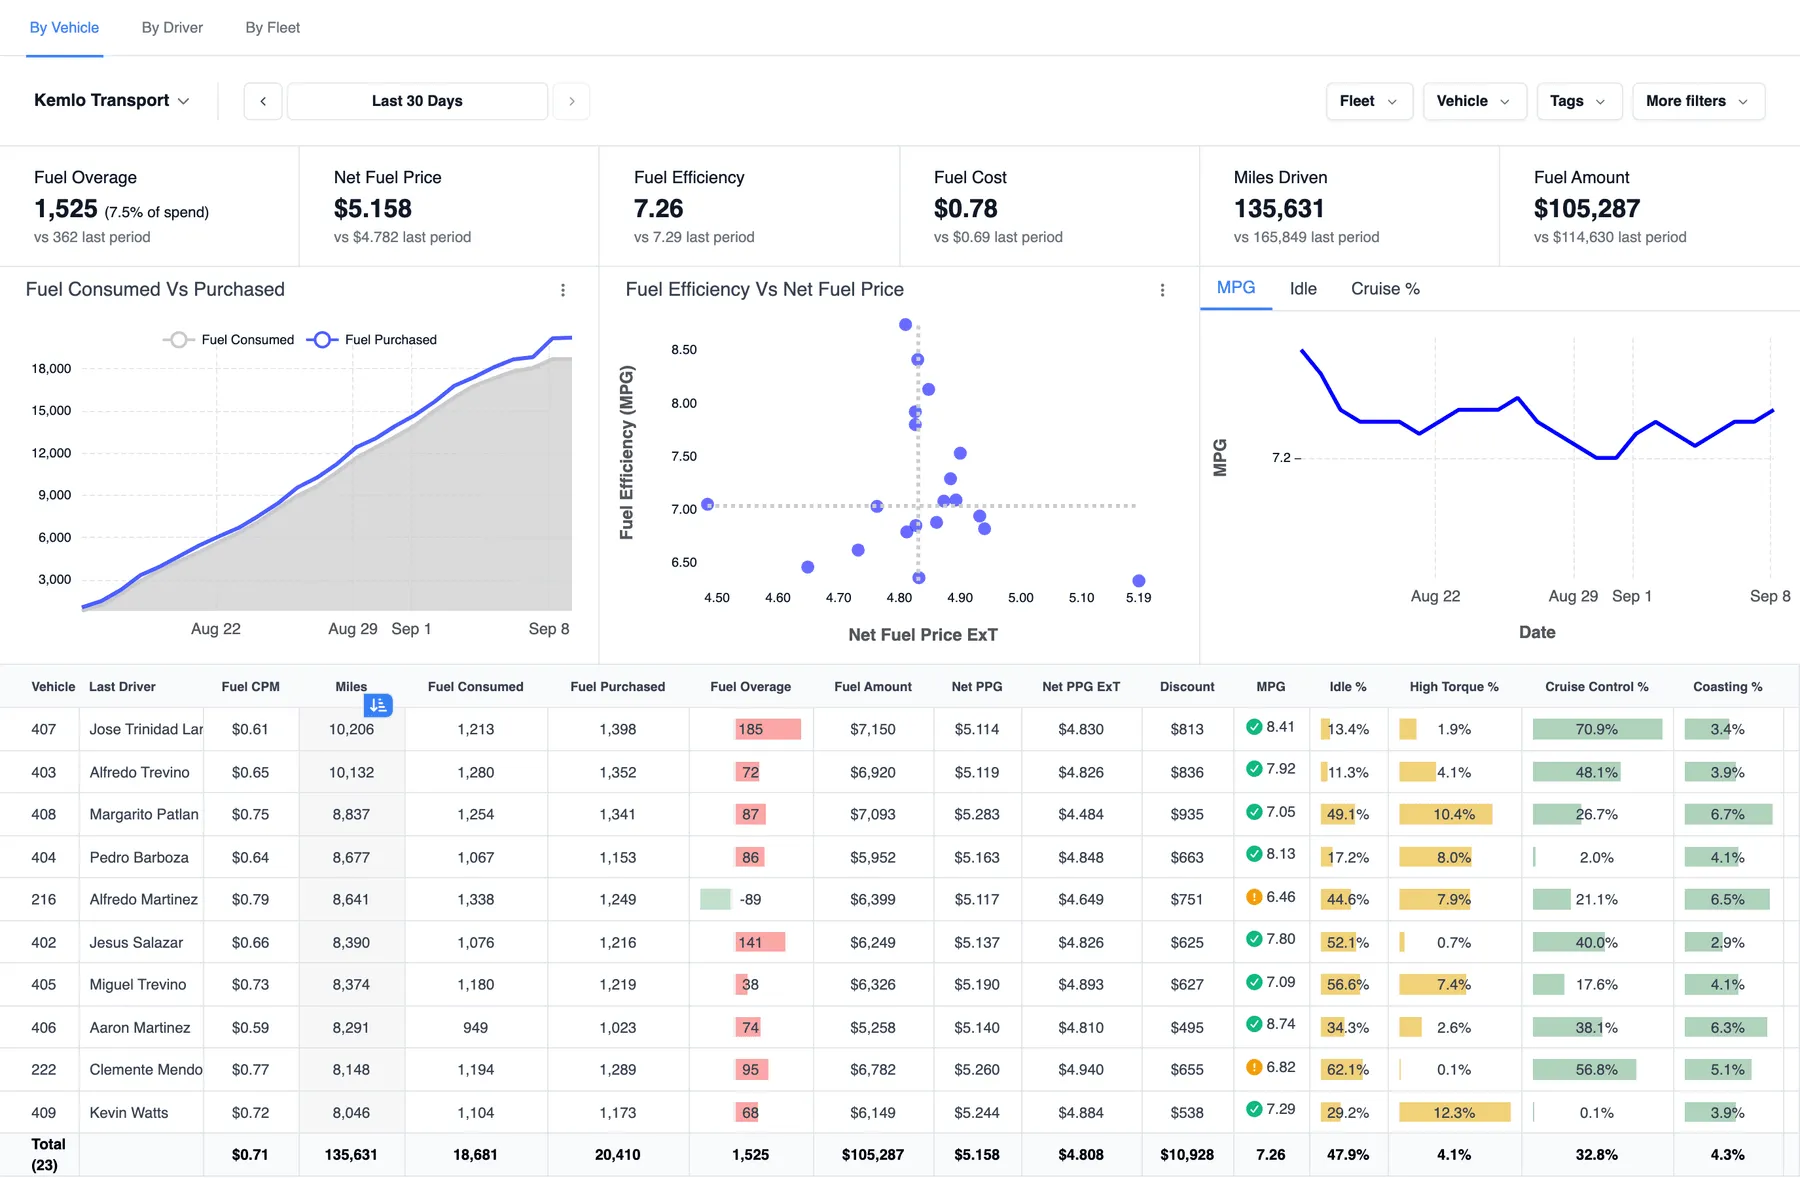
The Control Center: fuel overage, net fuel price, efficiency and cost per mile, by vehicle, driver or fleet.
Fuel Optimizer
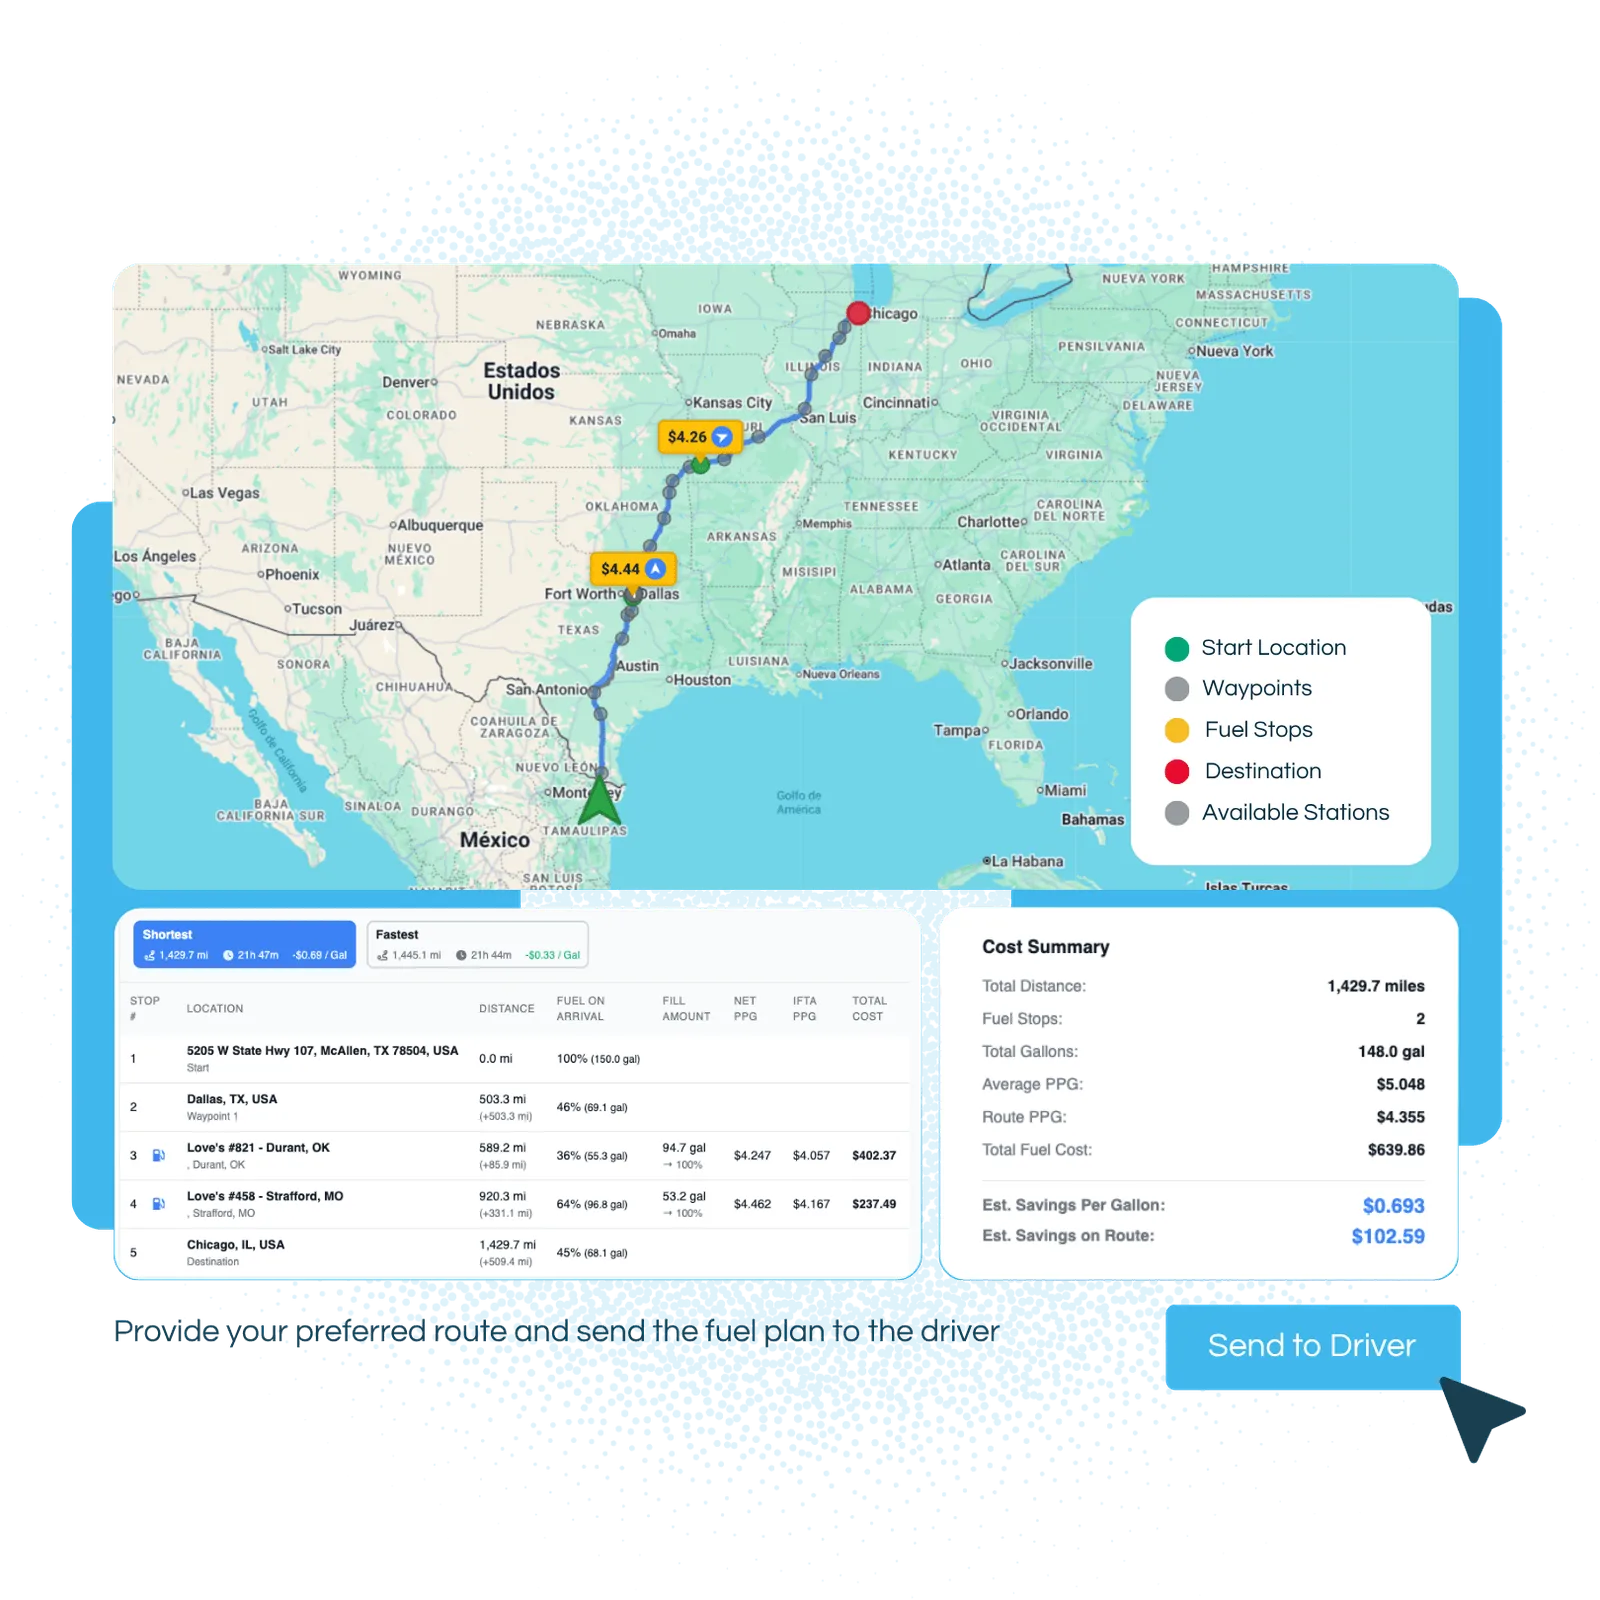
Optimize where and when drivers fuel
Fueling Performance helps fleets reduce fuel costs by guiding drivers to the right locations at the right time using route data, negotiated pricing, and fuel trends.
- Route-aware fuel optimization
- Fuel price movement alerts
- Driver compliance tracking
- Planned vs actual route visibility
Fuel Theft Monitoring
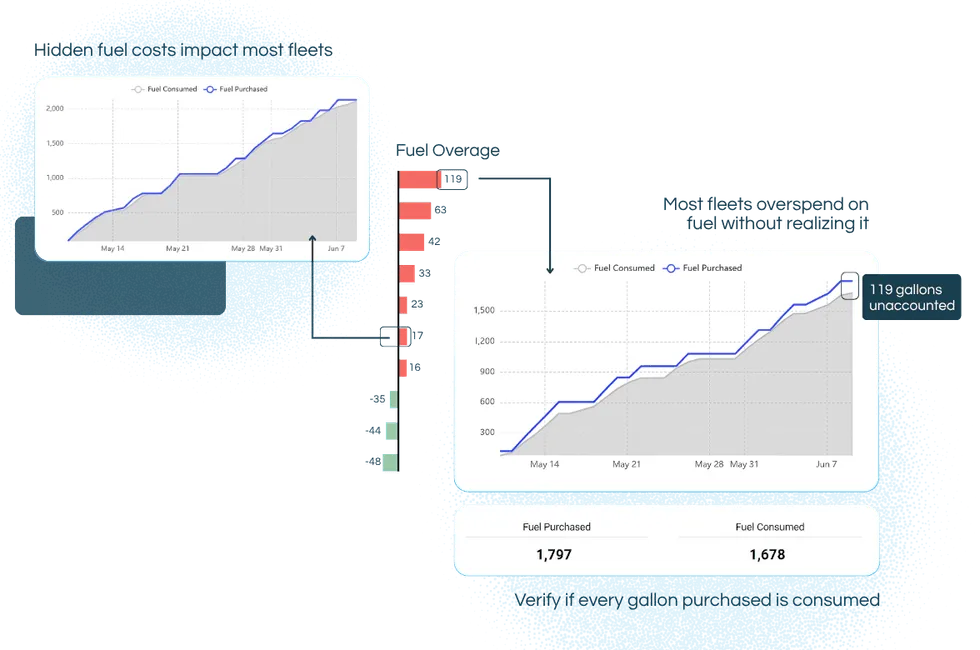
Monitor every gallon purchased and consumed
Fueling Performance compares telematics consumption data with fuel card transactions to identify fuel loss, suspicious activity, and operational anomalies.
- Purchased vs consumed fuel tracking
- Detection of recurring fuel overages
- Historical analysis by vehicle
- Automated anomaly visibility
Driver Performance & Efficiency Insights
Improve fuel efficiency
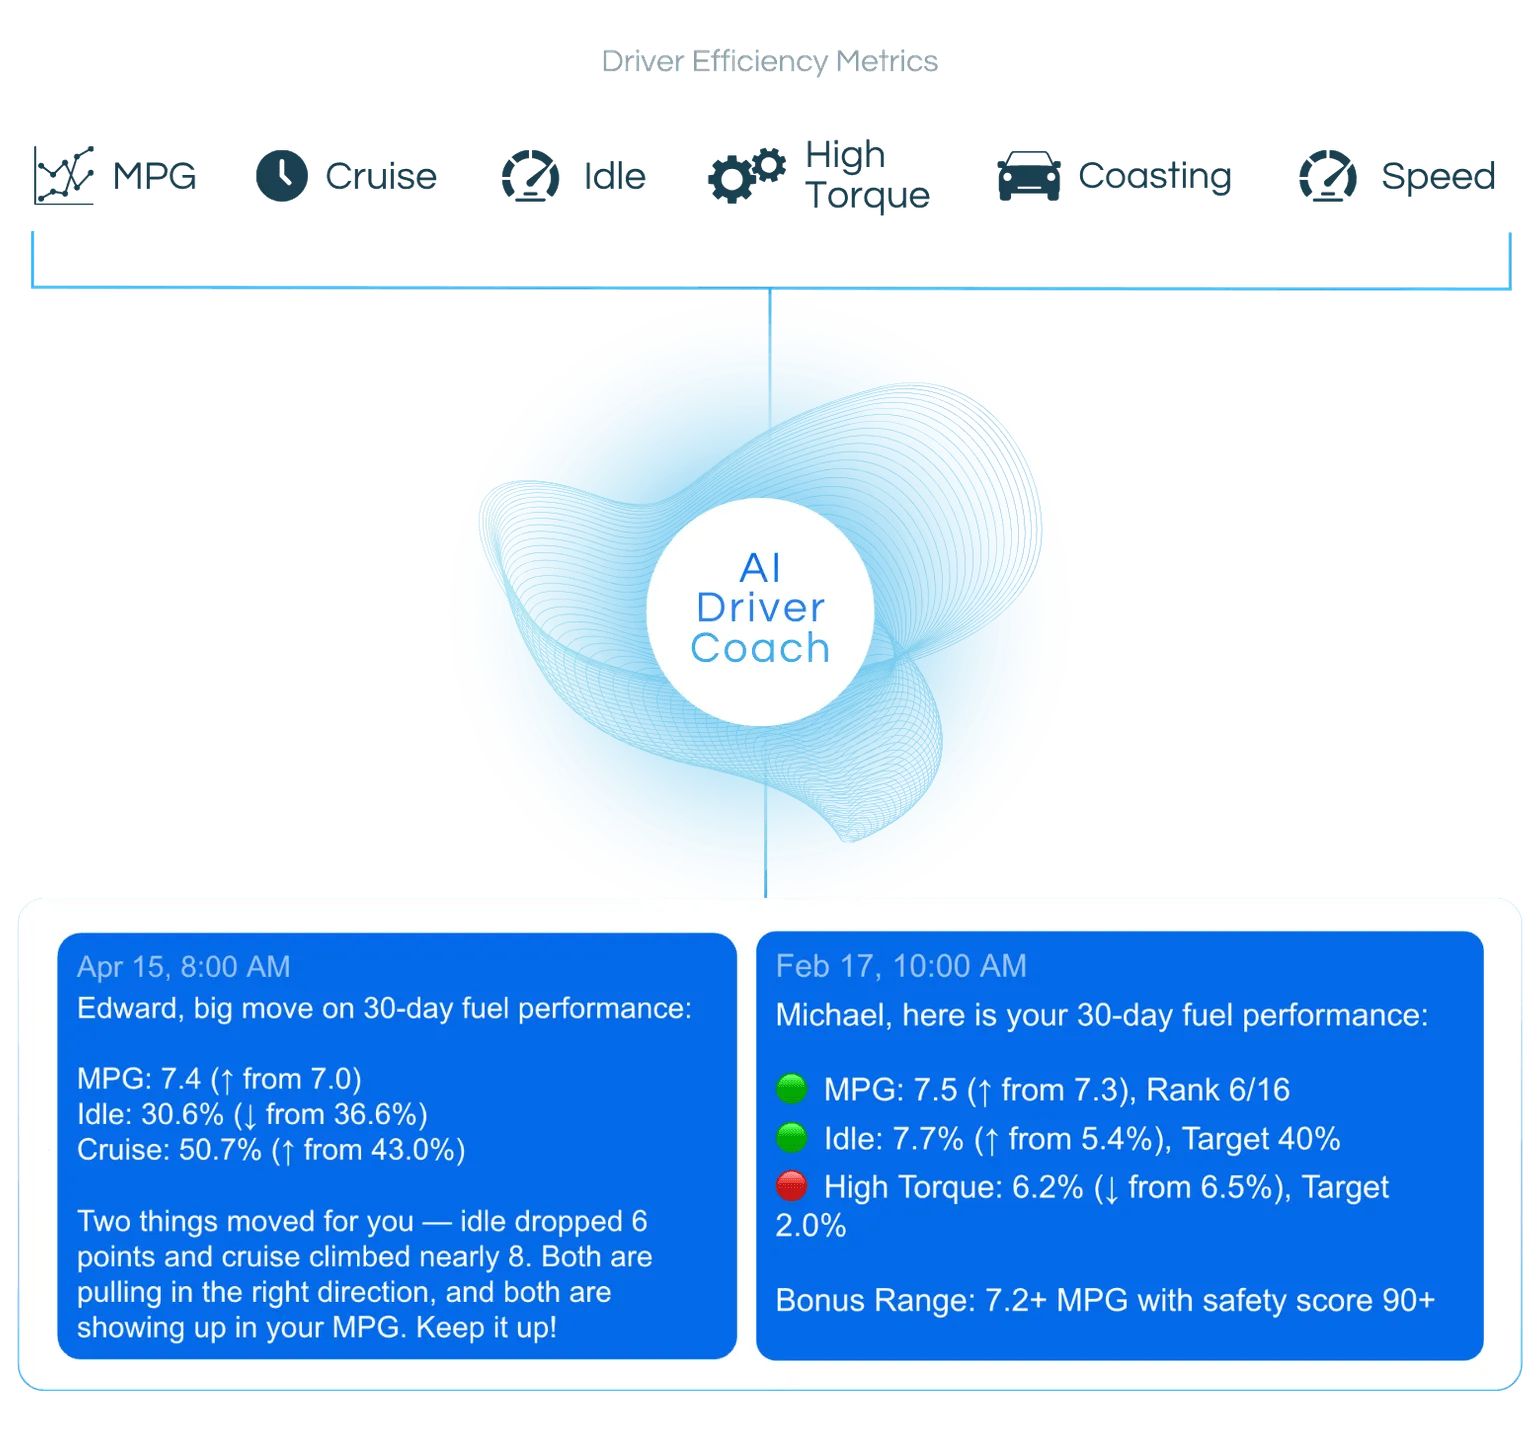
Track MPG trends alongside idle, cruise control, and driver behavior to identify performance drops and improve fleet-wide efficiency.
- MPG trend analysis by vehicle
- Driver behavior benchmarking
- Idle and cruise control visibility
- Maintenance vs coaching insights
New · AI agents
AI agents on your team
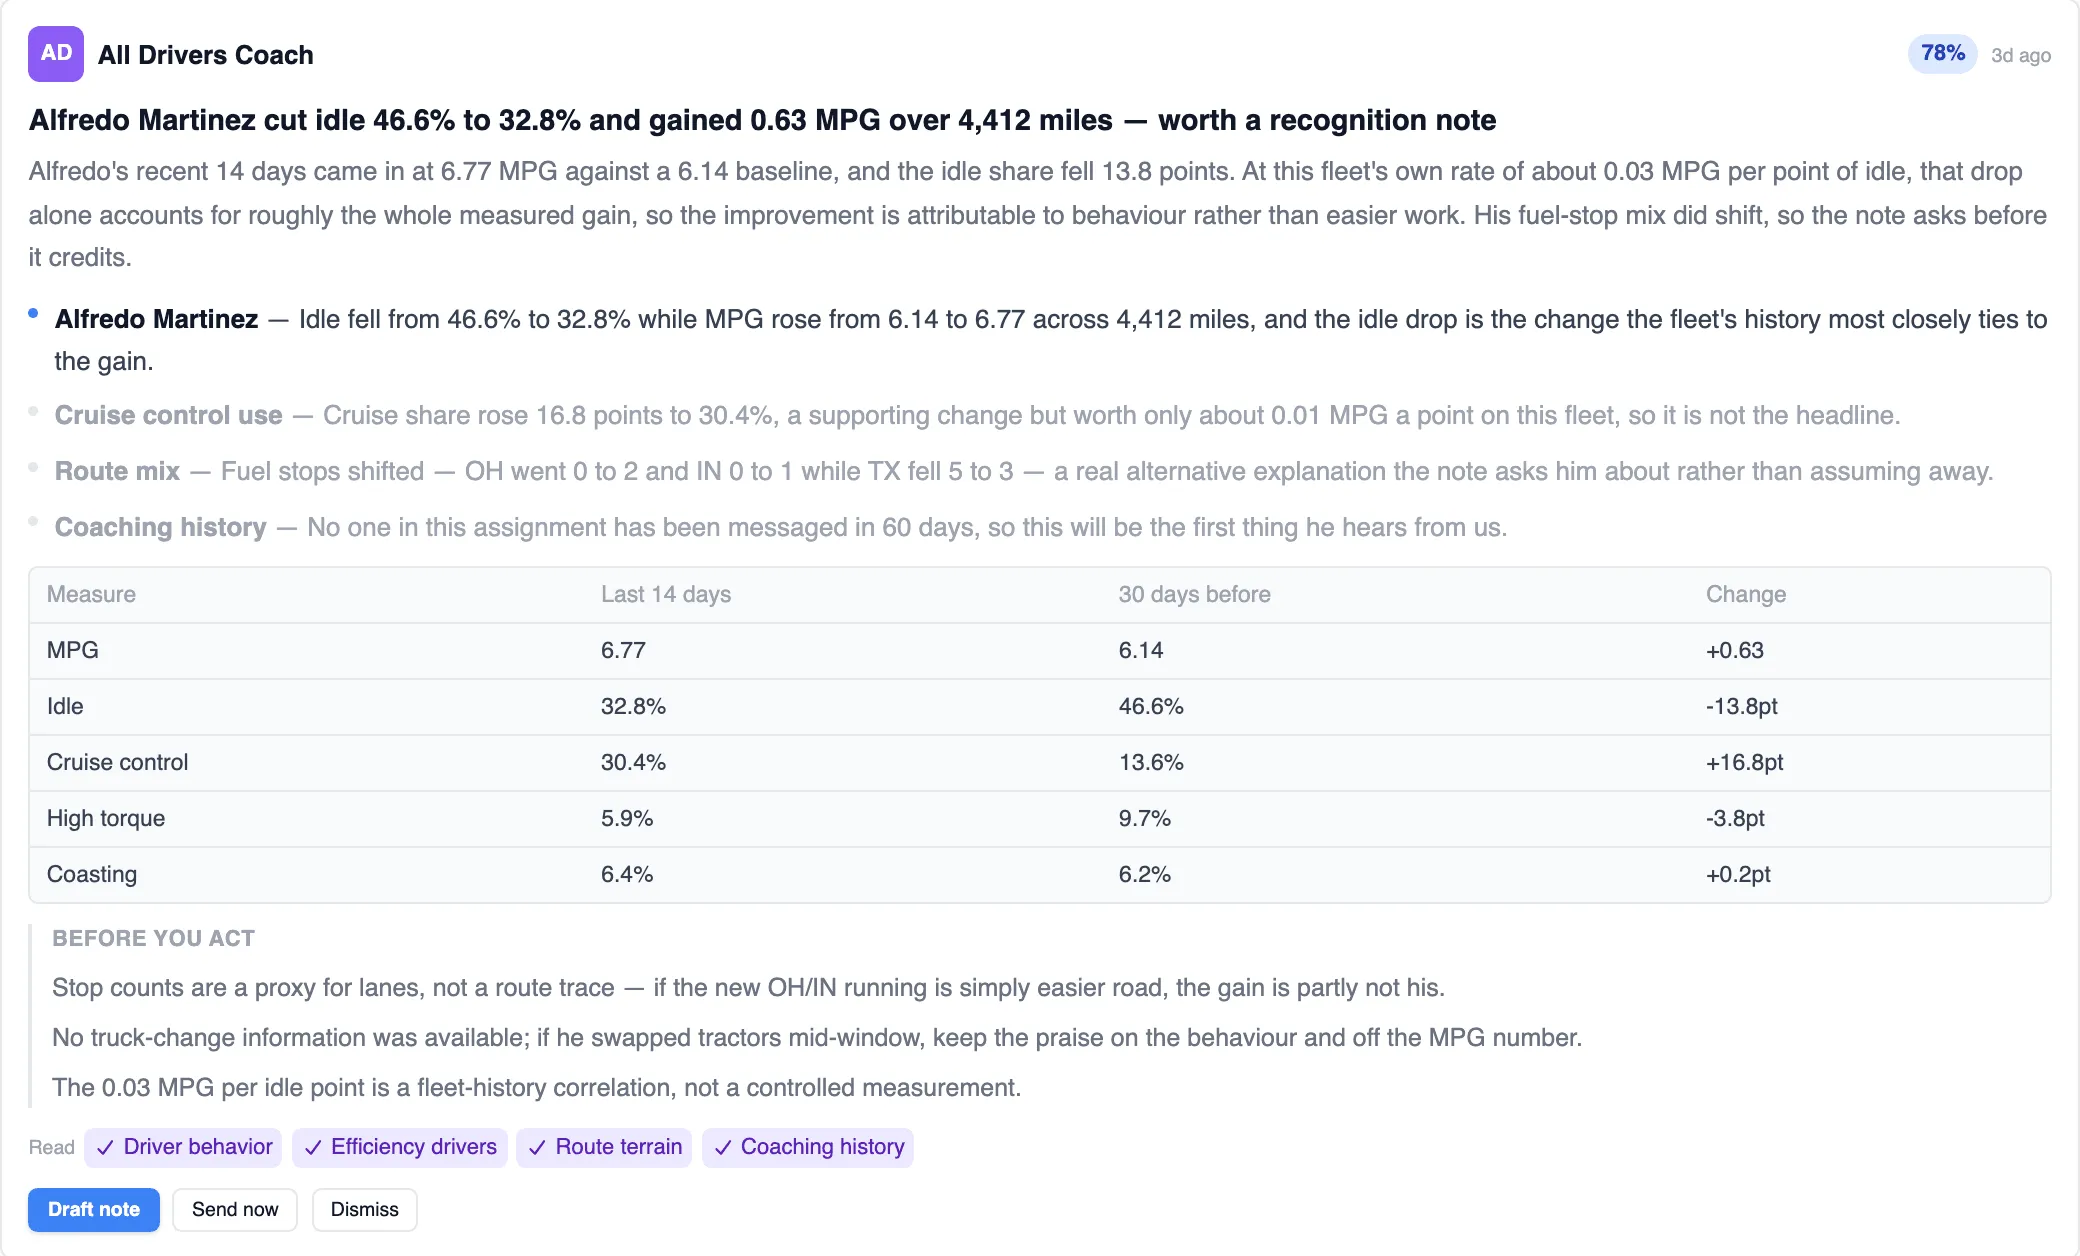
Hire a Fuel Analyst, a Driver Coach or Feed Watch, scope it to the whole fleet, one fleet, a tag or a single driver, and let it watch your fuel data around the clock. Every suggestion arrives with a confidence %, the evidence it read and a “Before you act” list, and nothing acts on its own until you move it up the ladder.
- Fuel AnalystKeeps your fuel record straight: finds dead gauges and quiet trucks, puts transactions on the right vehicle, fixes the mappings behind repeat mistakes, reconciles gallons bought against gallons burned, and tells the fuel buyer where the network has holes.
- Driver CoachCoaches drivers on how they drive, buy and follow their plans — one specific, askable note at a time, drafted for you to send.
- Feed WatchTells you when a feed stops delivering, before the reports quietly go stale.
- Off
- Shadow
- Suggest
- Approve
- Auto
Every hire starts in Shadow. Nothing without an undo goes past Approve, and a product update never moves a task up the ladder.
- 258 signals seen
- 7 proposed
- $0.74 of $75.00 AI budget
- Starts in Shadow
New · Automatic route optimization
Routes that plan themselves
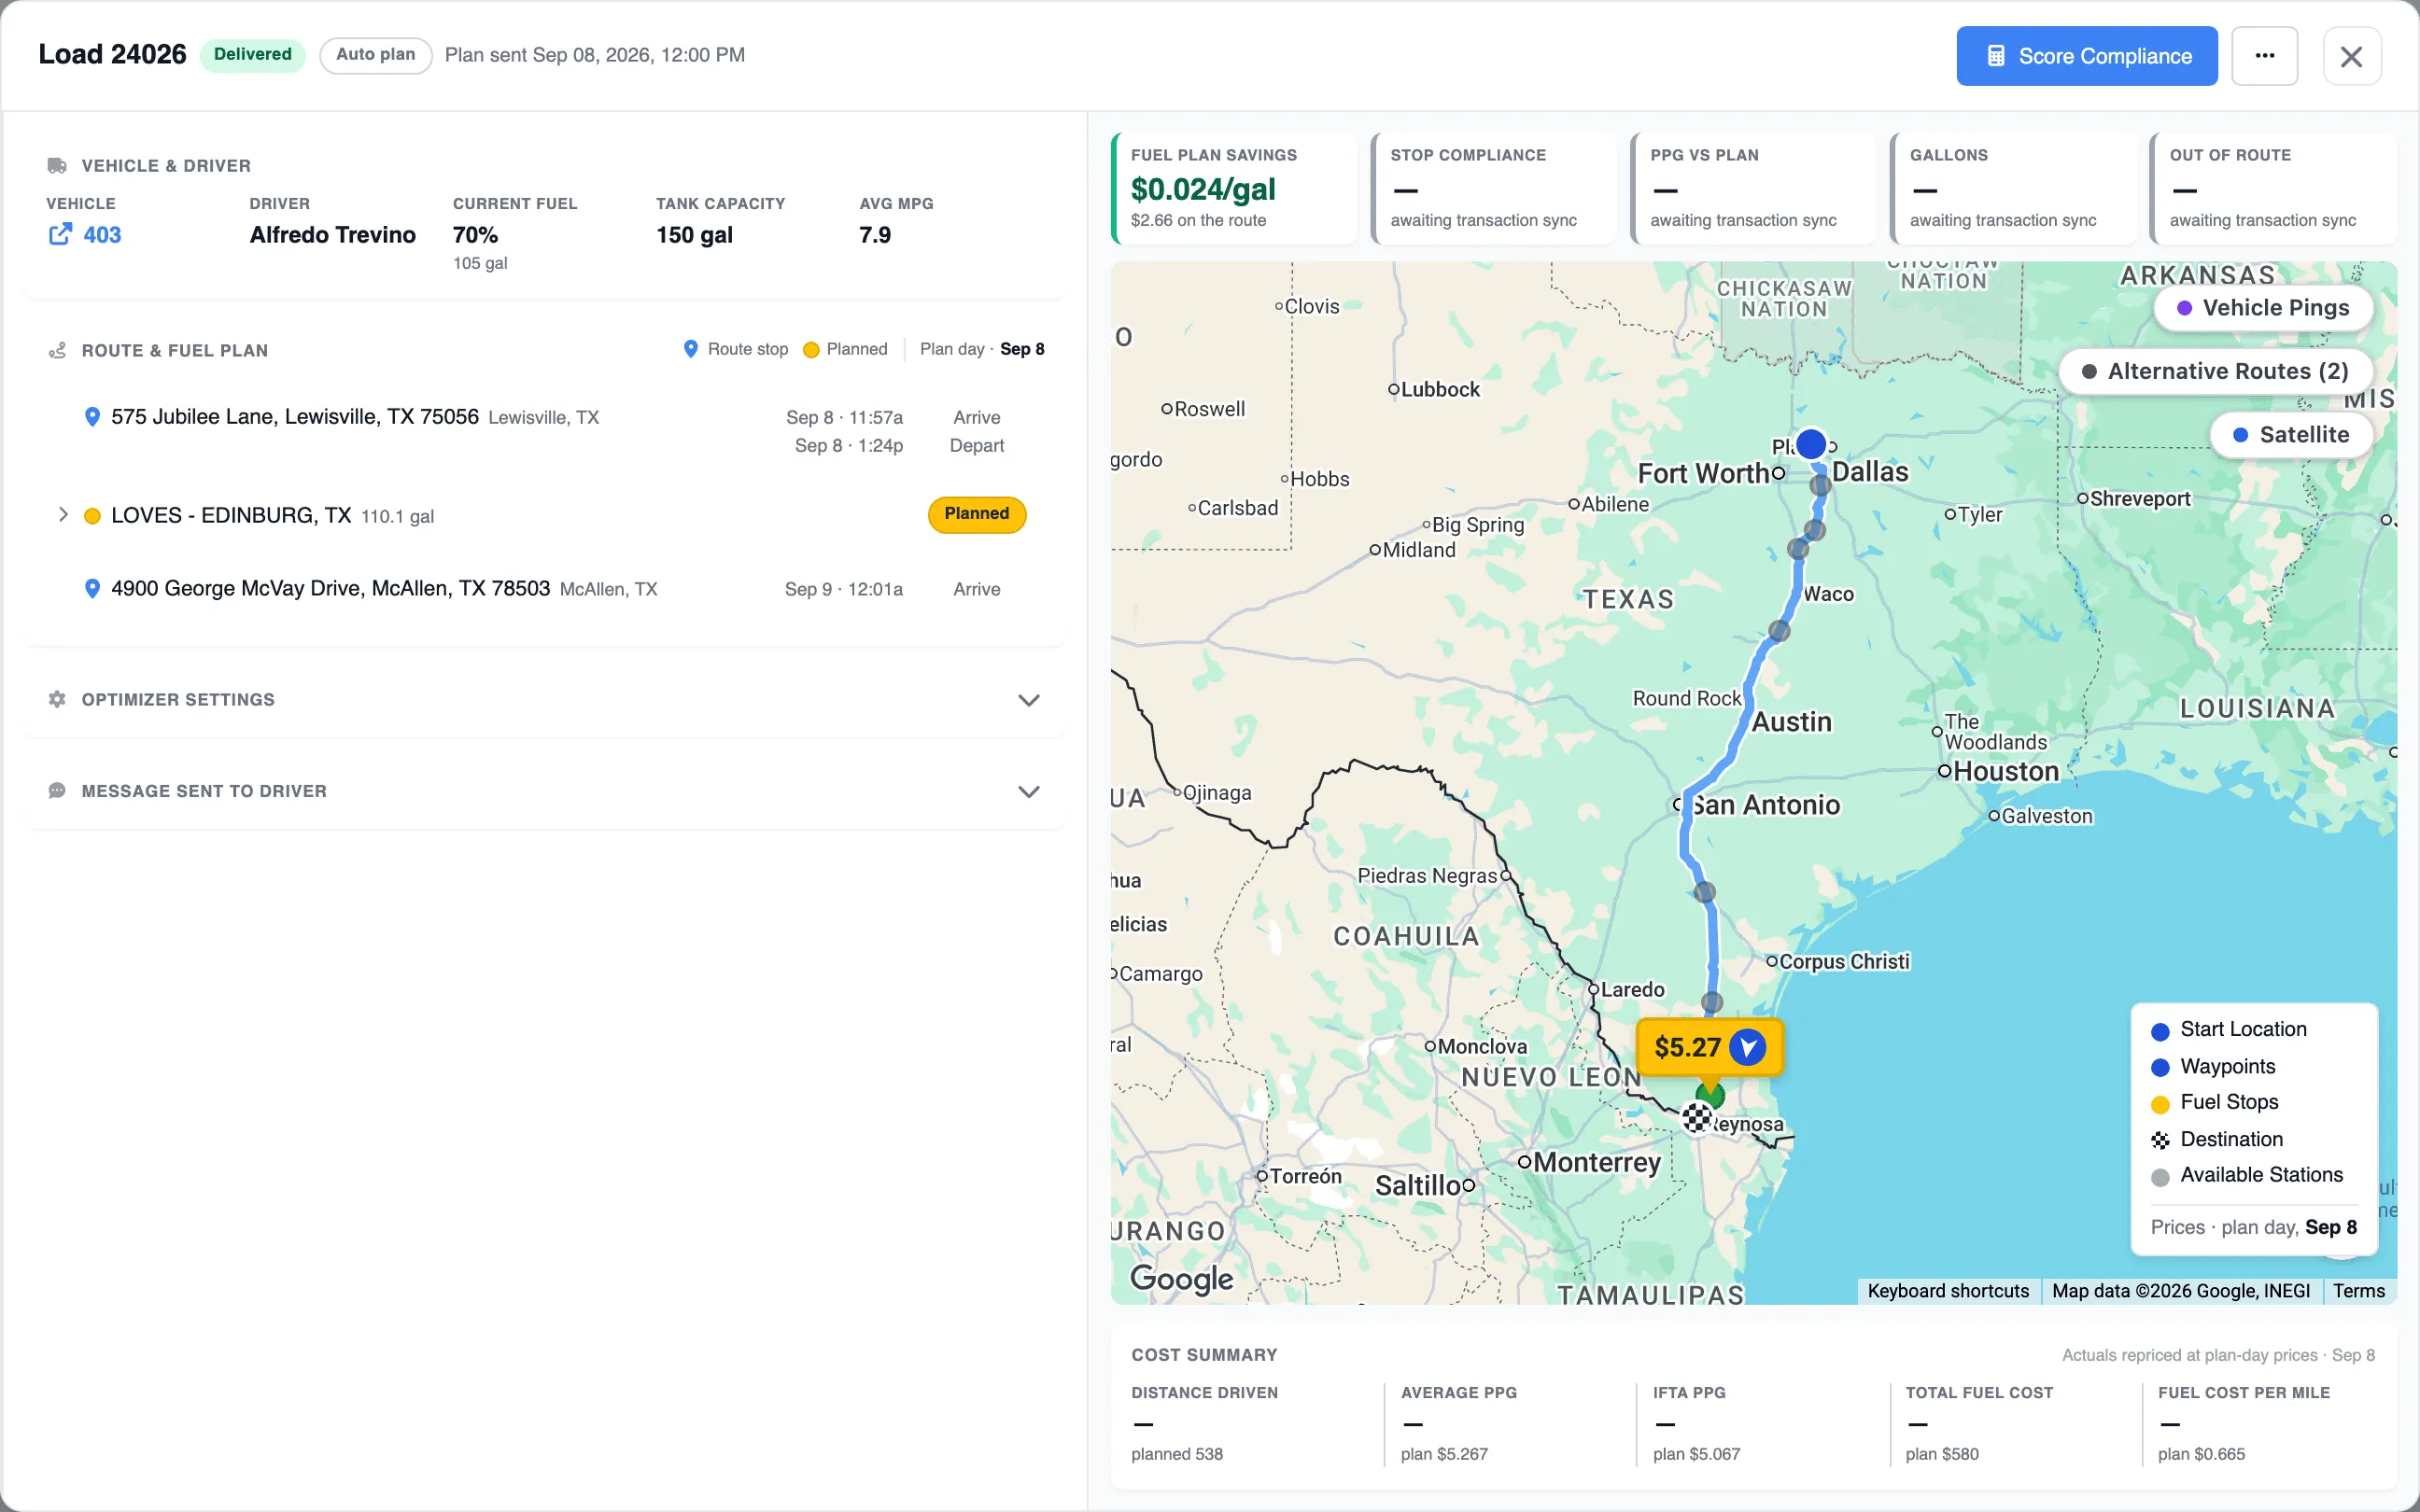
Routes arrive automatically from dispatch. When the truck reaches its first stop, Fueling Performance builds the fuel plan and sends it to the driver on the channel they already use.
Step 1: Loads become routes
Samsara and Motive routes, Alvys and DataTruck loads polled every five minutes, or any TMS pushing to the public API. Dispatchers can still create a route by hand.
Step 2: The fuel plan builds itself
When the truck reaches its first stop: which stations, how many gallons, at what negotiated price, from the vehicle’s live tank level, capacity and MPG, with alternative routes scored.
Step 3: The driver gets it where they already are
The ELD tablet message, Telegram on their phone, or SMS. Drivers also get their own phone page: fetch from truck, one tap to optimize.
Step 4: Compliance scored after the trip
Stop compliance, PPG vs plan, out-of-route miles and their cost, by fleet and by driver, worst offenders first.
The Fuel Performance Loop
A continuous loop built to improve fleet performance.
Connect operational data, identify opportunities, coach drivers, and improve fleet performance over time.
- DriverEngaged | Empowered
- ActionsIdle | Cruise Control
- OutcomesMPG | Fuel CPM
- AnalysisTrends | Correlations
- InsightsSuggestions | Coaching
- FeedbackInterpretable | Actionable
Improve Driving Habits
Two levers, one metric
A system designed to drive higher fuel efficiency
Reduce fuel costs
- Optimize net fuel price
- Prevent fuel theft and fraud
- Fuel plan optimization on every route
Reduce fuel consumption
- Improve driver efficiency
- Performance-based driver coaching
- Continuous driver feedback loops
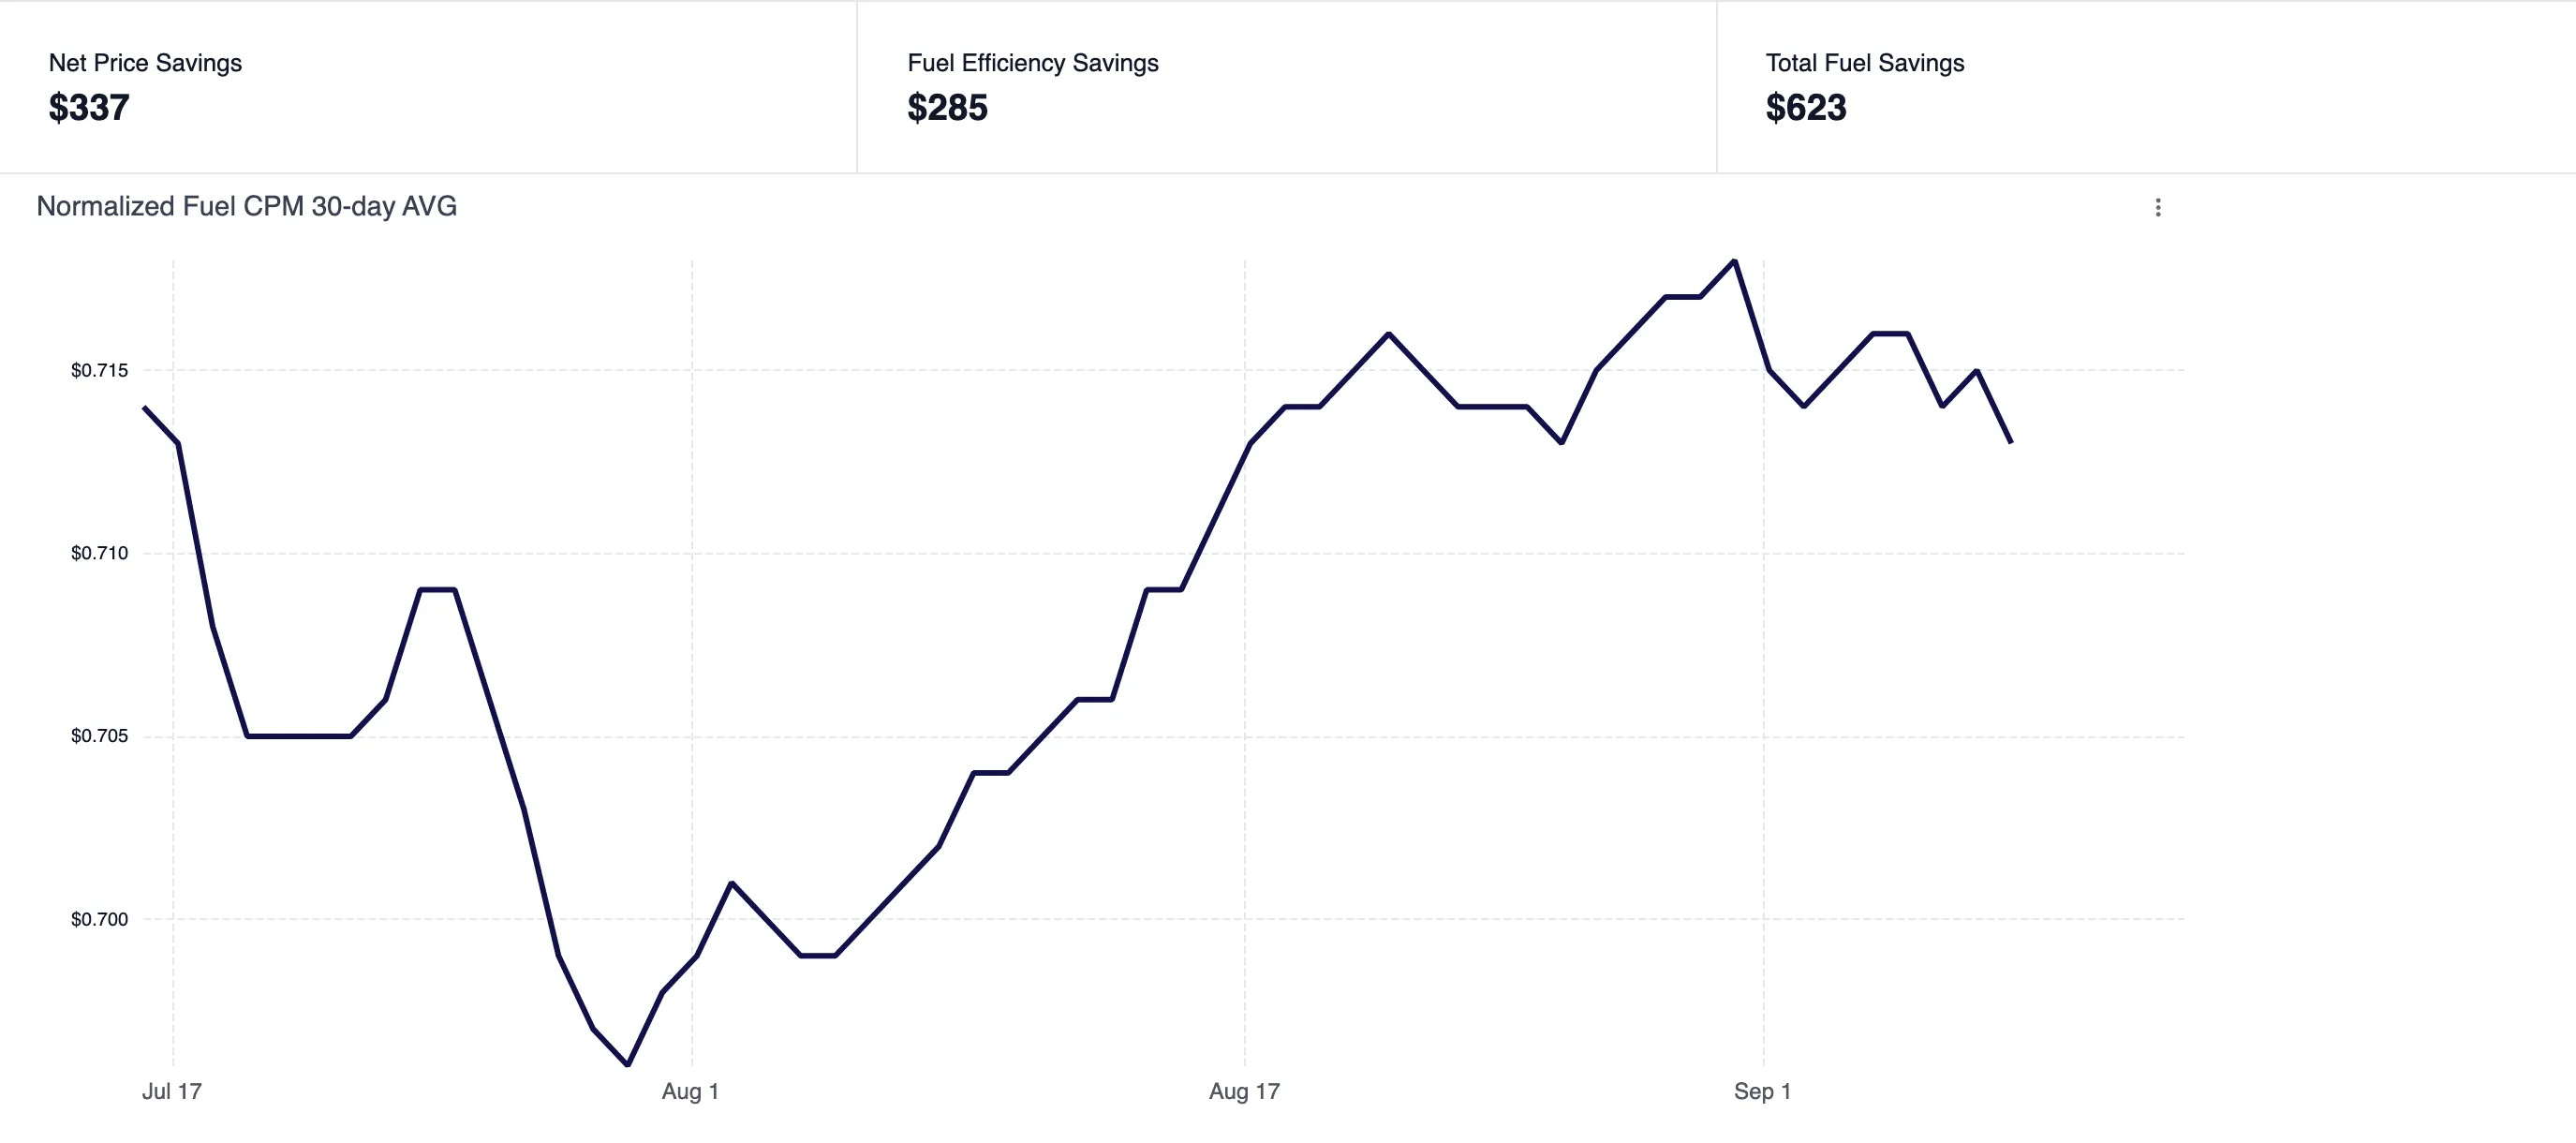
Lower fuel cost per mileHigher fleet profitability
A few cents improvement equals millions in annual profit.
Integrations
Works with the systems you already run
Live tank and GPS data feed the theft checks and fuel plans; fuel-card files feed transactions and negotiated pricing; pricing networks feed daily station prices; your TMS feeds dispatch routes.
Telematics / ELD
Live tank level, GPS and driver behavior
 Samsara
 Motive
 Geotab
 ISAAC
ISAAC Catena Telematics
Fuel cards
Transactions and negotiated pricing
 Comdata
 WEX / EFS
 QuikQ
QuikQ Relay Payments
Fuel pricing networks
Daily station prices
 Love's
 Pilot Flying J


Driver messaging
Where fuel plans and coaching land
 Telegram
- SMStext message
- ELDin-cab messaging
Public API
Push routes from any TMS with the API
REST and JSON, path-versioned /v1, bearer API keys with routes:write, routes:read, vehicles:read and drivers:read scopes. Push a dispatch route, read back the fuel plan with stops, gallons, prices and ETAs. 600 requests per minute per key; sandbox nvl_test_… keys; an OpenAPI contract at /v1/openapi.json.
# illustrative; the docs are the contract
POST /v1/routes
Authorization: Bearer nvl_live_…

{
  "externalId": "load-24016",
  "vehicle": { "unitNumber": "216" },
  "driver": { "name": "Alfredo Martinez" },
  "stops": [
    { "address": "Logan, OH",
      "plannedAt": "2026-09-09T06:00:00-05:00" },
    { "address": "San Benito, TX",
      "plannedAt": "2026-09-14T09:00:00-05:00" }
  ]
}
Testimonials
Savings from real fleet operations
From fuel optimization to MPG improvement, fleets use Fueling Performance to uncover operational opportunities worth millions annually.
Before Fueling Performance, we knew what we spent but not why. Now we control where, when, and how fuel is purchased. The savings showed up within weeks.
We uncovered fuel losses we didn’t even know existed. The ability to verify every transaction changed how we manage our entire operation.
Our drivers are more aware, more engaged, and more efficient. Fueling Performance didn’t just give us data. It changed behavior.
Savings calculator
What a 200-truck fleet takes out of fuel cost per mile
At our conservative defaults (200 tractors, $4.50 a gallon, 120,000 miles a truck, 7.0 MPG) the calculator lands here. Change any assumption and every number moves with it.
Each lever is calculated independently against the baseline, so the total is an upper estimate where they overlap. An illustration built from the inputs, not a quote or a guarantee.
Estimated annual savings
$1,362,622
$6,813 per tractor, per year · 39.7¢ per gallon equivalent on 3,428,571 gal purchased
- Fuel Optimizer10¢ × 3,428,571 gal$342,857
- Theft monitoring1.0% of gallons purchased$154,286
- Driver efficiency7.0 → 7.30 MPG$634,051
- Out-of-route miles360,000 mi × $0.643/mi$231,429
How does Fueling Performance actually lower our fuel cost per mile?
It works on two fronts. On consumption, we flag vehicles with declining MPG and coach drivers on idle, cruise control, and high torque. On cost, we help you buy fuel at better prices and catch theft before it eats into your margin. This is usually the number one expense after drivers and wages, so a few cents per mile adds up fast.
What telematics providers does this work with?
Telematics and ELD: Samsara, Motive, Geotab, ISAAC and Catena Telematics today. Fuel cards: Comdata, WEX/EFS, QuikQ and Relay Payments. Daily station pricing from Love's and Pilot Flying J. Dispatch routes from Alvys and DataTruck, or from any TMS through the Fueling Performance API.
What can we actually see in the Control Center?
Everything in one place: fuel spend, miles driven, fuel cost per mile, MPG, idle, high torque, cruise control usage. You can break it down by driver, vehicle, or terminal, and compare across terminals, regions, or divisions. If your fleet average is 73 cents fuel cost per mile, you'll see which vehicles are in the low 50s and which are up in the low 80s, so you know where to look.
What's the Fuel Optimizer and how is it different from just picking the cheapest station?
The optimizer looks at your whole route, not just the next exit. You give it a vehicle and destination, and it overlays your negotiated pricing along the route to pick the best fueling locations. Since we know the planned route and mileage, we can also measure compliance, whether the driver actually fueled where we told them to.
How does the optimizer decide when to buy fuel?
We monitor fuel price trends and help drivers make smarter fueling decisions based on expected market movements and your negotiated pricing. When there’s an opportunity to buy more strategically, drivers can receive guidance directly so they know when and where to fuel.
How do you catch fuel that's being stolen or misused?
We compare fuel purchasing activity with vehicle consumption and telematics data to identify unusual discrepancies. Those flags help teams investigate potential misuse, fueling anomalies, or recurring patterns before they become a larger problem.
What kind of savings have fleets actually seen?
Fleets have seen meaningful savings by shifting fuel purchases toward better-priced locations instead of fueling wherever is most convenient. Even within the same region, price differences between locations can be significant, creating a real opportunity to lower fuel cost per mile.
What does driver coaching actually look like?
An AI driver coach sends personalized engagement campaigns based on each driver’s efficiency metrics, from simple scorecards to AI-generated feedback. Campaigns are configurable, allowing fleets to focus coaching on the behaviors and opportunities that matter most to them.
What's the compliance score measuring?
Two things: fulfillment, whether the driver loaded the recommended amount of fuel, and discipline, whether they stopped at the recommended location. The overall score combines both to give you a clear view of fueling compliance.
Can we control who sees what in the platform?
Yes, permissions are flexible. We can hide entire columns or pages depending on the user. Negotiated discounts, for example, are typically only visible to authorized users, not terminal leaders or drivers.
What's on the roadmap?
We’re continuing to expand proactive alerts, optimization capabilities, driver coaching, and AI-powered insights across the platform. The goal is to help teams identify opportunities faster and take action with less manual analysis.
Next step
Book time to review your fuel operation
Walk through your fleet data and identify where cost, loss, and efficiency can improve. Use our Calendly scheduler to pick a time that works for you.